Google search console insights can now let you easily track your growing content.
In a bid to help site owners understand their content relevance with their audience, Google search console insights was launched on June 15, 2021.
The prime purpose of launching the search console insights is to create easier reports for site owners by combining the site data taken from both Google search console and Google Analytics.
Collaborating with these reports, webmasters can easily understand how their website’s content is performing online.
Now to make this journey more awesome, Google search console insights has brought a new report called “Your Growing Content”.
The official Twitter handle of Google Search Central has shown how this new report looks. Check the below tweet.
Now, if you look at the image attached in the above tweet, you can see that this report shows “how much has your content grown in the past 28 days”. Here growth means the increase in impressions and clicks.
This report is valuable when you optimize any existing webpage on your website recently and want to track its effect on Google search. I mean, after making the change, whether the impression and clicks on the webpage grows.
This new report is slowly rolling out for all the users. So, if you may not have seen it now you will definitely see it.
Below I have talked about different reports available in search console insights.
What are the Different Reports available in Google Search Console Insights?
Google search console insights have the below listed reports right now:
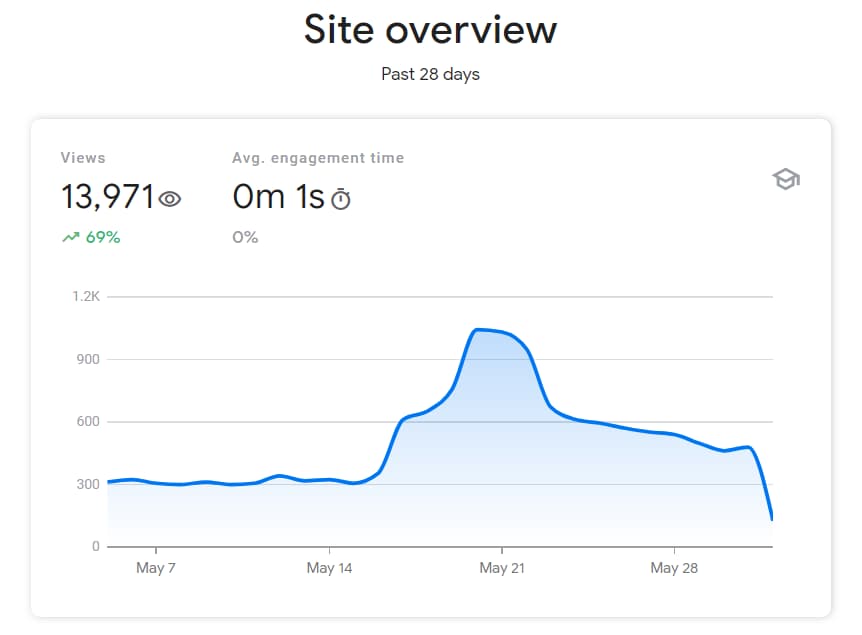
Site Overview
This report tells you “the number of views your website has got in the past 28 days”. It also shows you the “average engagement time”. This report also presents you with a graph through which you can track how your website traffic performs in the past 28 days. Check out the below screenshot to see how this report looks.
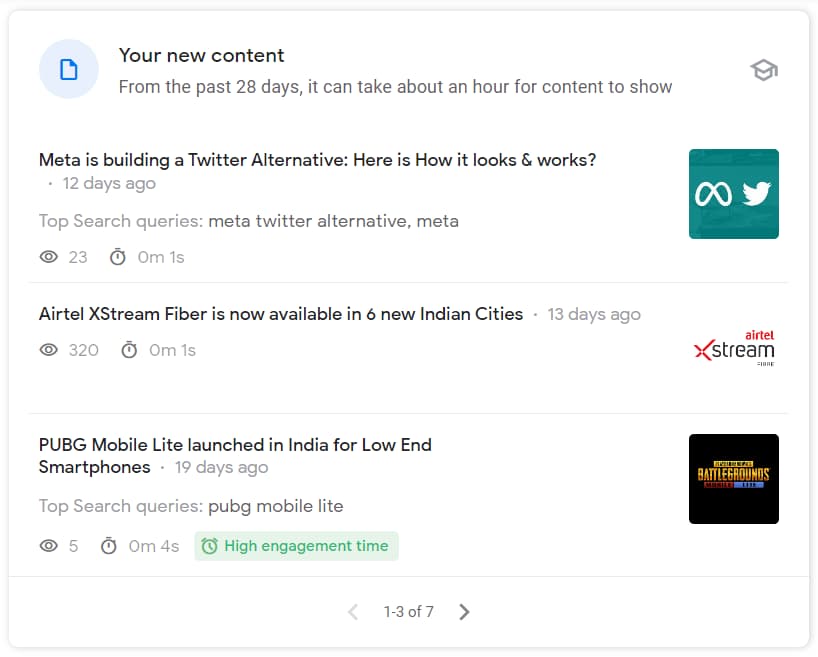
Your New Content
After the Site Overview report, when you scroll down, you will see a new report called your new content.
This report shows some performance metrics of your content that you have published in the last 28 days.
Here you can see:
- What are the views each content got (that has been published in the last 28 days)?
- Through which keywords, users are finding that specific content of yours online.
- What is the average engagement time of each content?
The report also marks a content with “High Engagement Time” tag, if it has a comparatively higher engagement time.
Check out the below screenshot to see how this report looks.
Your Most Popular Content
When you scroll down further, you will see a new report called “Your Most Popular Content”.
As its name suggests, this report collates the most popular content of your website in the past 28 days, which means, contents that are getting the highest number of views. The report sorts the contents from highest to lowest views. You can also see the average engagement time of each content.
If any of your popular content is trending (means its views have suddenly increased in the past few days), the report marks those content with the Trending Tag with a trend percentage.
Please see the below screenshot to see how this report looks.

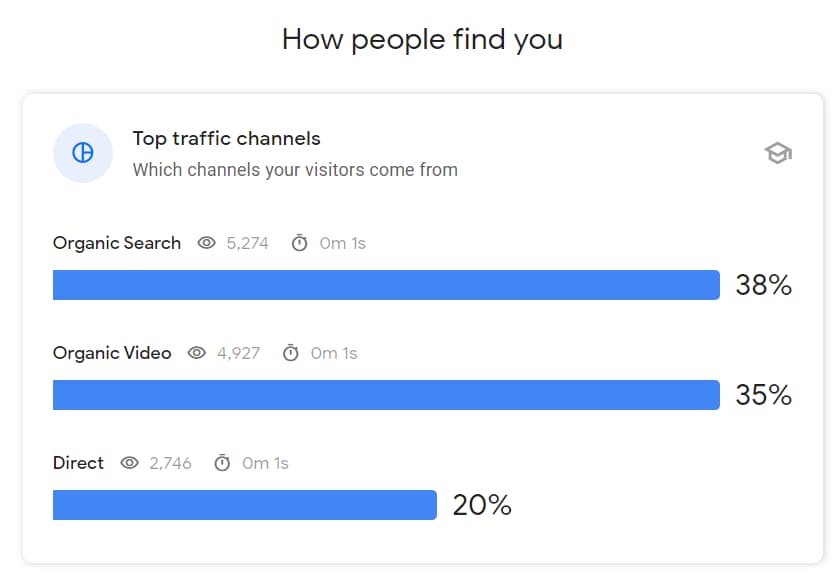
How People Find You
This report lists all the channels through which your visitors come from.
For example, organic search, organic video, direct etc.
The report also marks the percentage, number of views, and average engagement time of each channel.
Here is how this report looks.
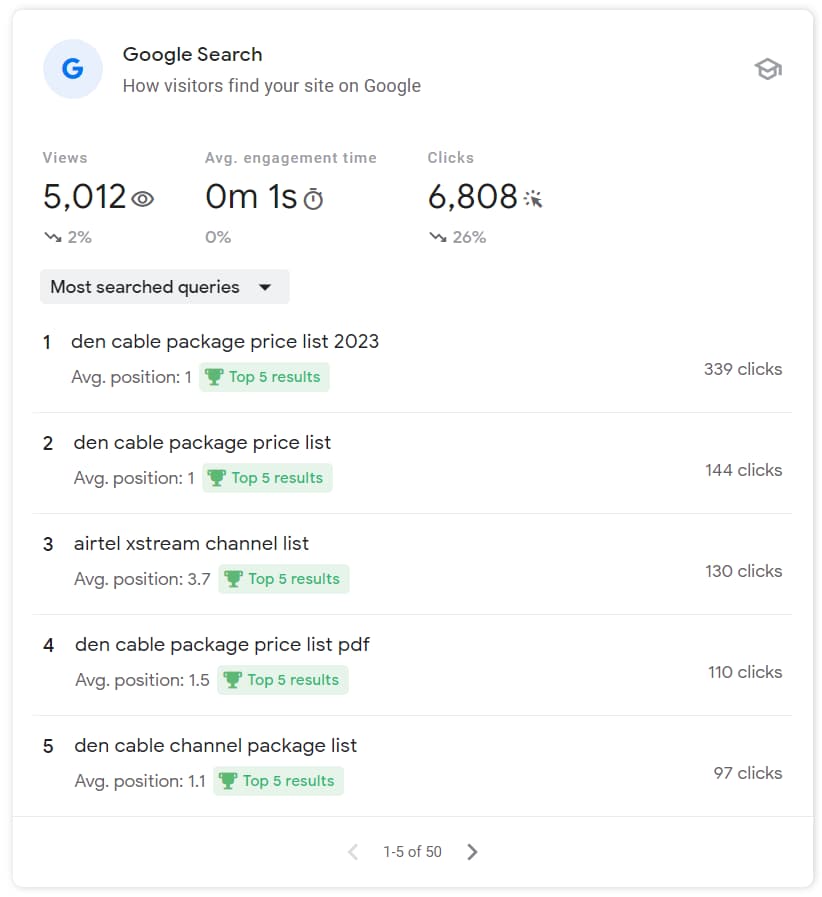
Google Search
In this section, you can see the list of keywords through which visitors find your website on Google.
Here you can see how many clicks each keyword brings to the webpage for which it is ranking.
Also, the average ranking position of the webpage on Google search for each keyword.
If any of your keywords are in the Top 5 position, you see a Top 5 results tag as well attached to the respective keyword.
Referring Links from other Websites
Google search console insights also have a backlink checker kind of report.
Here you see the list of links referring to your website in the past 28 days.
There are two options to see the referring links:
- You can check the top referring links from the past 28 days.
- And the second one is Newest Referring Links from the past 28 days.
While I found this section pretty helpful but since, Google search console insights is in beta right now, this section doesn’t show me all the backlinks I have got for my website.

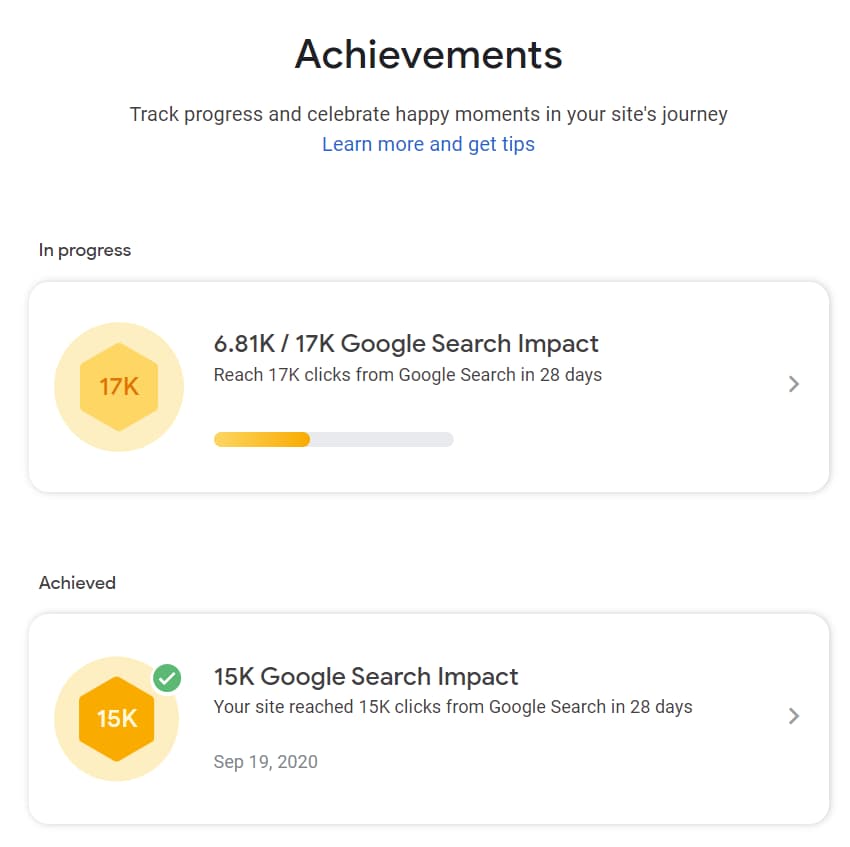
Achievements
At the very top, you will see a new section that Google search console insights has added recently called Achievement.
This section helps you to track the progress and achievements in your site’s journey.
It also motivates you to reach new goals for your website.
In my opinion, it is a good section to keep a larger view of your website.
Here is how it looks.
Google search console insights is going to be a great tool as it presents more refined data in front of web owners. For taking just an overview, it cuts the burden of analyzing data from Google search console and Google Analytics and collates them at one place.
So, what are your thoughts about Google Search Console insights, let me know in the comments down below.